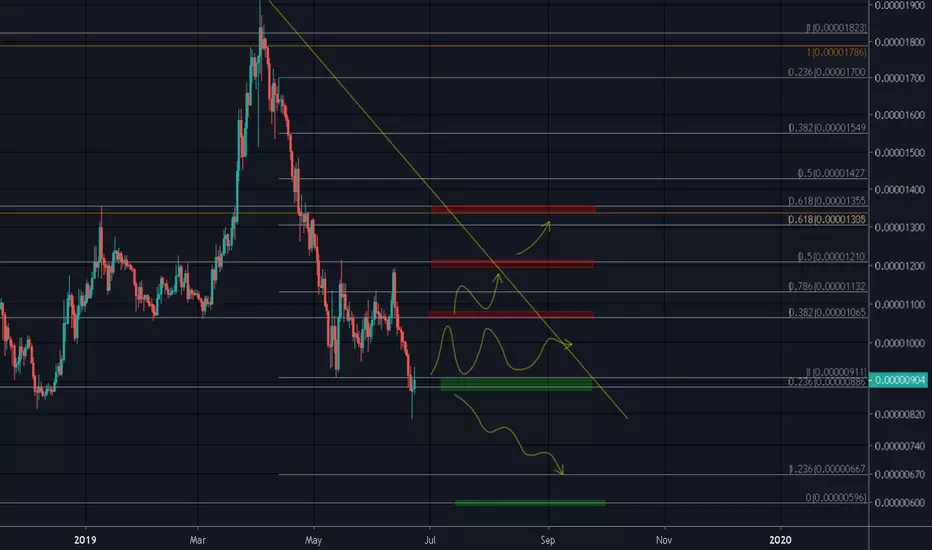
ADA/BTC: Bulls getting readyADA has been ranging around historic support for a couple of weeks now, finally starting to look bottomed out. The 3 day here still looks pretty bearish, and a test of lower support in the blue box may occur.
Cautiously long here (below 900 sats), if BTC breaks down ADA may also get taken down with it, potentially to new lows. 1000 sats is the red dotted line that is drawn on the chart, and this serves as a target for the long/heavy resistance.
If a breakout past 1000 sats occurs, a swing up to the red box (resistance) may be feasible
Still somewhat bearish on alts until BTC has a confirmed bottom or there is some more momentum across the board on alts as most have been in free-fall for the past couple weeks.
No longer posting links in trading view descriptions, but you can find my twitter in my trading view profile bio. I have a discord group which can be found on my twitter.
Search in ideas for "ada btc"

ADA/BTC may drop further before riseThis is a follow up to our last Cardano idea that busted.
So, without further ado, let's check out what's going on:
As one can see above, Cardano is still in the midst of its traded range.
We called a short on this before from 1200 with a really tight S/L on it (-2.38%), but that S/L ended up getting busted the same day, unfortunately.
We were looking at a tight S/L on this trade due to the x10 leverage on BitMex.
As we scroll in a bit further to examine the traded range that Cardano (ADA/BTC) is currently in on the daily resolution, it appears as though the price is headed for the 1100 sat support.
Relative Strength Index(14)
The divergence between the RSI(14) and the price action is definitely noticeable on the daily resolution. This could definitely be a sign of impending positive price action for Cardano.
Exponential Moving Averages (Daily Resolution)
Zerononcense Reversion Ribbon V2 (Custom)
The reversion ribbon is signaling weak selling action, which defends our assumption of a potential retest at the 1100 sats.
Zerononcense Price Bands
The Zerononcese Price Bands also confirm our assumptions regarding ADA/BTC price action as well.
Conclusion
Based on everything that we're seeing, the proposed R/R is as follows:

ADA/BTC bearish continuation or possible trend reversal? After a massive bull run, ADA is doing a ABC correction.
Also we see a falling wedge, if ADA falls through support (yellow circle), I expect bearish continuation. The 0.786 fib line (2250sats) could be a perfect buy zone. Buy orders should be placed within the red box.
If ADA hold support at this level 3000sats, then I expect upward movement. The RSI is oversold, this triggers people to buy. When we hit the upper line (resistance) and volume kicks ADA could breakout, This indicates a trend reversal, possibility for another bull run.
This is not financial advice.
If you have any feedback or remarks, please feel free to comment below.
Peace and trade safe!

ada btc stocks trading crypto 90% gains
RSI showing over sold.
MACD showing over sold
80-100% gains if we see a volume increase. keep in mind ada has lost 22b in market cap, it has been sleeping for weeks now, not long until the 3rd generation gains back that 22b plus,
then you will be looking at 300% gains minimum just if it does back to its original peaked price.
get the word out ADA ADA ADA !

ADA/BTC Pair extrapolating to predict possible 2021 topJust an idea on where I might expect ADA/BTC pair to go by year end. I haven't done a lot of research into ADA fundamentals but price action has been strong this bull run so far and continues to hold it's own compared to other alts.
If you have other ADA/BTC ideas to share I'd love to see them.

ADA/BTC (bullish retest ?)ADA / BTC
the chart against BTC is clear
Here we can see whats look like a retest to 50% fibonacci level at previous resistance level
Bounce is expected from this area
For the pair against USDT positivity start as long as ADA hold above 1.20$
Good luck

ADA/BTC - Longterm (altseason) plan - 1300% Potential at ATHCardano BTC
My plan for the upcoming alt cycle, starting with Carndano (ADA). Well known for its solid fundamentals, high chances this project will be among the high gainers if/when the next altcoin cycle starts.
Currently, we're able to draw a high timeframe falling wedge, and after almost a 90% drawdown a relatively cheap project to pick up.
Aiming for an entry at 574 satoshi's, as indicated on the chart, as this is the lowest point in history which ADA has seen.
Profit target 1: 1369 (238%)
Profit target 2: 4200 (631%)
Profit target 3: 7569 (1318%)
Stop loss: Riding this one out without a stop loss, this will be a longterm plan.
For those who feel like having a stop loss on your investments, I can recommend anything under 400 satoshi's (the lowest point of the wedge). Don't get faked out!
Best of luck, may the target entry and profit targets get hit, in that order.

ADA/BTC Update - Yellow line is a downtrend line that set from may 2018 toward recent high on April 2019, this might as well be a clue whether if price action could break that down trendline will be a good early sign for bullish trend awakening, conversely, being rejected by this downtrendline could result a continuous sign for longer bear trend.
- ADA/BTC is on critical point which it must be hold at 900 satoshi. See the projection of the price whether in the future ADA/BTC could hold or not.
- While in short term, i believe there will be an attempt to bounce above the fibonacci resistance on 910 because indicators mostly on oversold area.
Indicators :
- MACD : macd line is already made a lower high despite the price action is managed to made a lower low (bullish divergence). seller histogram is slowly decrease as for now.
- DMI : Trends overall still bearish but -DI (seller pressure) is begin to go lower and +DI (buyer pressure) is begin to go slight higher. ADX (momentum strength) is still low for now.
- Stochastic RSI : stochastic RSI is on bottom level and start to rising at least on a short term,.
_Thank you for your time to read this post and please take this idea as a grain of salt as reality always differ from what i expect as this post merely just an opinion.
and please feel free to share what your thought on comment section.
peace._
ADA/BTC hit Target and then came the BTC spike, now what ?Cardano had hit target at purple 4.236 and was ready for retrace.
Then came the BTC short squeeze which brought all ALT/BTC down.
ADA had one of the best recoveries, and is holding initial support well.
Purple 2.618 was the expected retrace even without BTC pump (4.236 to 2.618 is common).
Green 5.618 is now acting as support from higher timeframe, but its influence might not last.
Purple 3.236 should offer secondary support, but if broken then lower zones come into play.
Bigger picture, I am still optimistic about hitting the second and third targets on this plot

ADA / BTC: Consolidation and levelsSomething key to point out here is that ADA could still experience a a large drop if broken downward from this range, as it is resting above support right now. It appears ADA has consolidated and started to trend upward. That being said, still facing some tough resistance, and I drew some large resistance levels above in the green boxes.
Some pretty good and clear upside here is a breakout happens, and I would be paying attention to ADA for volume and price activity with the potential of an upcoming Coinbase listing.

ADA/BTC Tactical analysis / Buy opportunity-We have bounced on a major weekly support, and have made some higher lows on the daily.
-We broke the previous high on the 4H and started retracing.
-Should see the .705 retrace to that 4H breaker and attempt to break the next resistance.
Daily view:
Terms:
-Bullish breaker - an orderblock (a green or red candle, in this case green) that precedes a move that took out a previous swing low, but was later nuked through. If the price comes back to that block, it is expected to act as support
Colors I use for a more organized chart:
15 min - Cyan
1H - Gray
4H - Red
Daily - Green
Weekly - Orange
Original idea by Svarog

ADA/BTC - short term potential tradeHello guys,
ADA/BTC 1 hour chart,
Quick trade with tight stop loss.
I just bougth ADA becouse of:
1. Nice support (the blue line on the chart)
2. Low RSI
3. Low bollinger band's
4. Stoch about to go up
Don't forget, you can trade ADA at bitmex with leverage , so 3% with x10 that's nice trade,
You can also use my refferal link for 10% discount on fee's for the first 6 months - www.bitmex.com
You’re more than welcome to follow me for more Analysis
***Do not consider it as a trade advice.

ADA/BTC my second favorite coin Sharing my long targets for ADA/BTC, don't miss out on this one just buy and hold.
Also take a look at some great analyses made by HamadaMark:

The dream trade pt2 ADA/BTC ADA/BTC is about to get hot in the next 2-3 months.
I advise everyone to start considering trading their BTC for ADA in preparation for the altcoin season that will start in late summer or during fall.
If BTC manages to hit $100,000, expect Cardano to hit at least $5.90 per coin.
Please leave a comment bellow and let me know what you guys think?

ADA/BTC LONGSignal
ADA/BTC
BUY
Open 453;
SL 439;
TP 554;
Risk/Reward: 1/7.21
Penetration of a triangle + good candles + BTC falling domination

[UPDATE ADA] ADA/BTC IS SCREAMING: 14$!!!!!ADA/BTC is telling me something different. Something even more bullish.
Let's see.

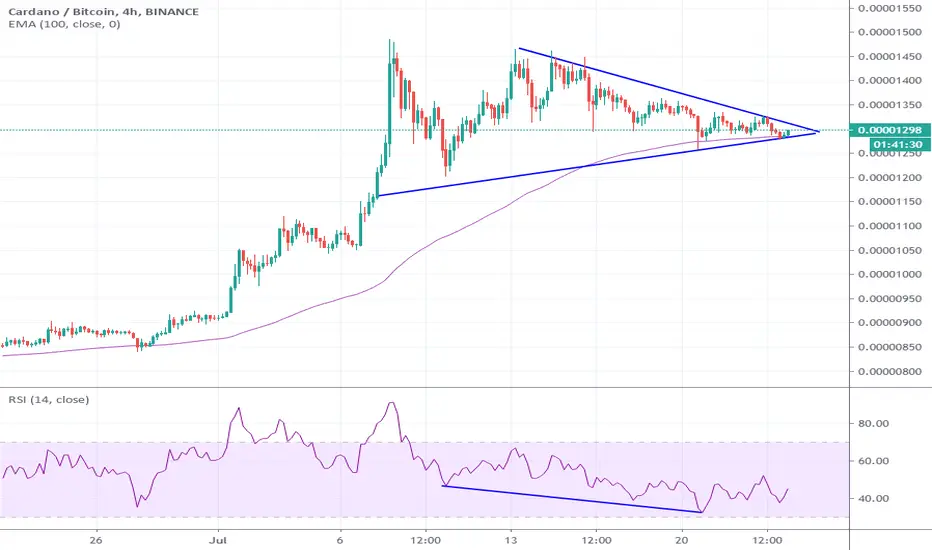
ADA/BTCAn analysis on ADA/BTC:
Symmetric triangle pattern has been formed as a bullish sign of continuation. ADA is sitting on the weekly support and 100MA on the 4hrs. The bullish divergence on the 4hrs has been also confirmed.
With the hardfork for staking coming in 29 July, I strongly believe that ADA will pump soon.
Note: If you like the content and the setup, please give me a follow not to miss out on many altcoins charts to come.
ADA/BTC Perfect Waves Standing for BUYHello everyone!
I started counting waves on this pair last week, and has just finished.
ADA has turned bullish and has possibly completed 4 waves out of 5, it is currently in wave 2 of 5 sitting right on 0.618 level.
I expect Cardano to break out resistance and moon hard in wave 3! 1416-1530 zone is where I see the next massive retracement after the triangle break out.
There are no special announcements in near time, but there is a Blockchain Conference with ADA speakers and expect them to say something promising, in case if I am right with my technical analysis assumptions. Also have a look at MACD that shows a divergence, and two MA crossing up.
However, if we take waves theory outside, The best move for ADA/BTC to prove start of uptrend is falling down to 1000 satoshi and then boom. That way a perfect IHS pattern will form and the price will start a strong bullish move.
Summing up, I advise you to buy on retracement after the breakout of triangle 1/4 of total position, then increase it by another 1/4 on 1279, then look close for price action aroung 1320-1350 levels and buy the rest.
Rejection of this scenario is break of 1117 support.

Ada/Btc Chart make A divergenceAs we can see that ADA/BTC make a Divergence chart which rsi also be make a divergence now ADA/BTC market condition of bullish but macd now not bullish
Note.The market is normal bullish any time make a big bullish

ADA/BTC - No comment Doing some research and discovered this
July 1 2019 '_______'
Exchange subjective of course
Accumulate long for the 16.88 R/R
Bid to 3000 sat
T/P 0.001 ada/btc per #chartporn
Buy any dip ADA/BTC long

irCryptoClub - ADA/BTCADA/BTC
According to the USDT market analysis that was presented on the public channel last week, the $ 1.51 range is a very strong resistance for this currency and as long as it is below this range, the correction trend will continue.
By examining the chart in the BTC market, the most important resistance range is around 0.00004500 and it is expected that the price will reform again after reaching this range.
Comparing both charts in two different markets, we can say that the price correction of this currency is not over yet and we will probably see a cross trend in the coming weeks.
If necessary, the analysis will be updated again

ADA BTC BREAKOUT!!A double bottom has formed for the ADA and BTC trading pair AND it is breaking out of the descending triangle!! Be prepared for a major RALLY!!

ADA/BTC progression on the 4 hourCurrently bouncing around inside a descending triangle, which mirrors the ADA/USD pairing as well. I'm waiting to add to my position after BTC comes out of it's tight range, and makes a macro move.
